Welcome Homeland
Critical Analysis
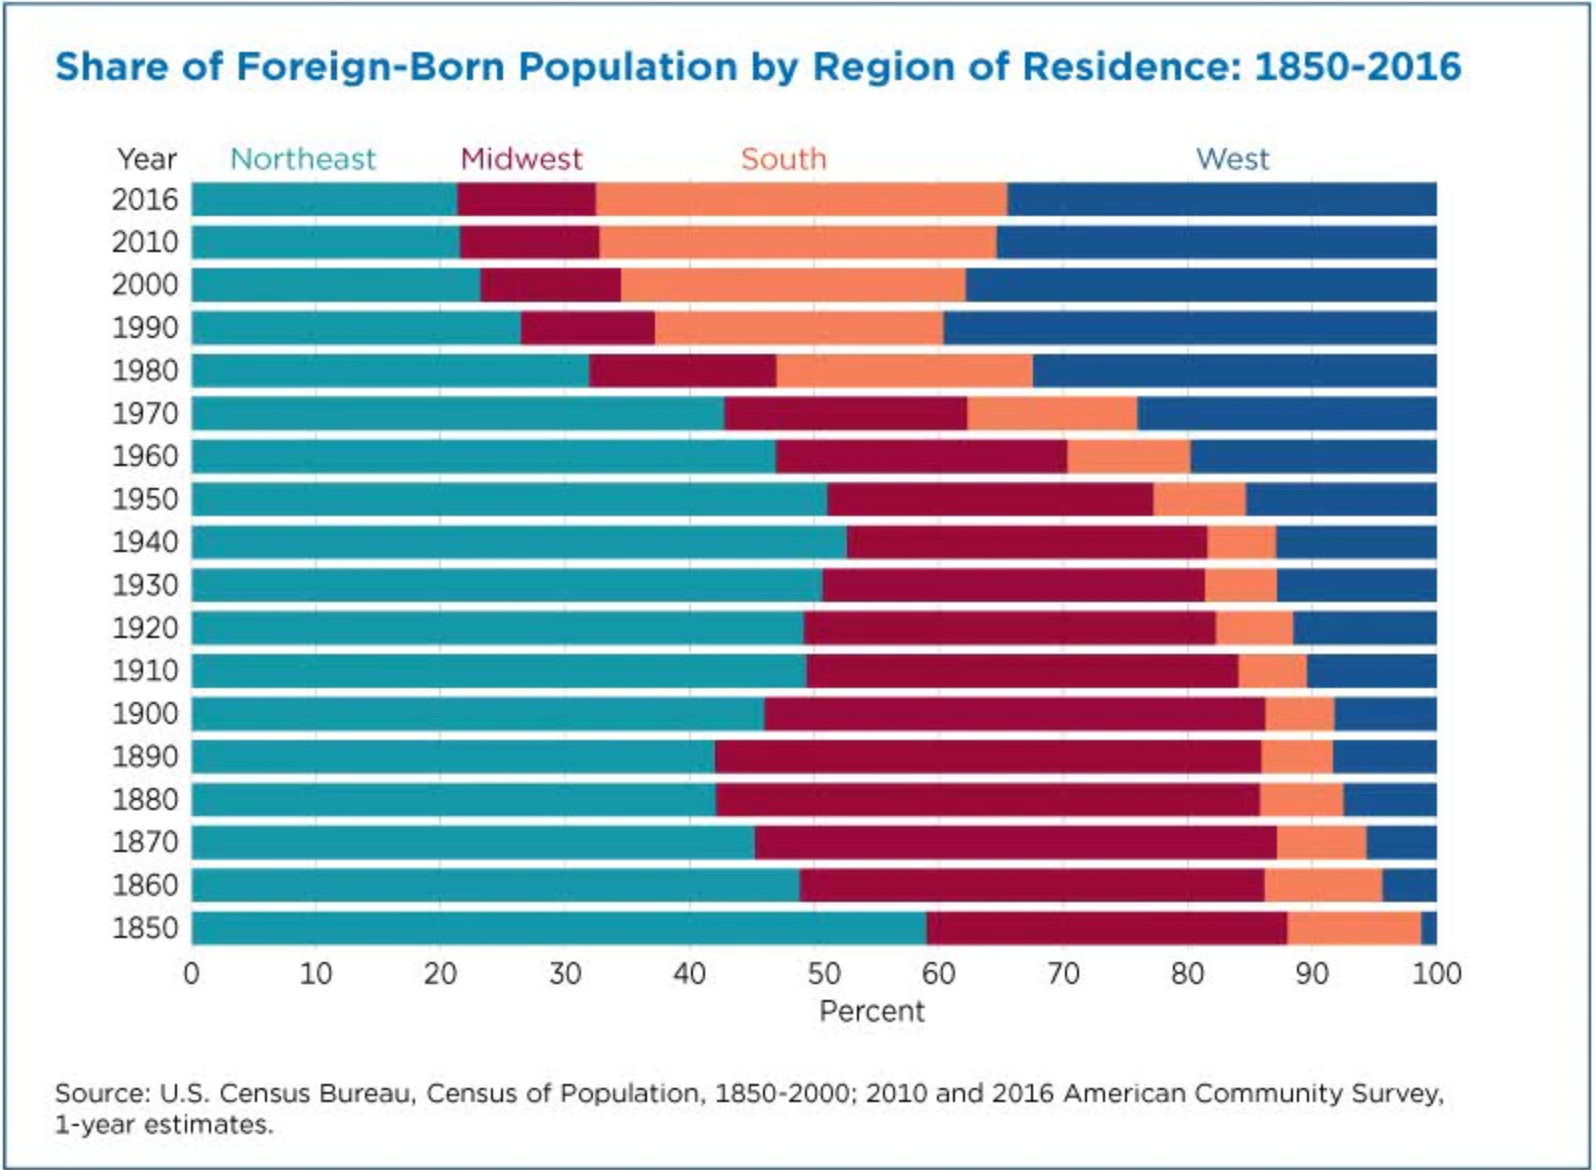
Based on the data from the graph above, what portion of the total U.S. population was foreign born in 2010?
By 2018, according to the U.S. Census Bureau, the percent of the U.S. population that was foreign born had risen to 13.7%. Describe one trend in the foreign-born percentage of the U.S. population over time.
List two major reasons for immigration to the United States (these could be push or pull factors) between 1850-2020.
List two political consequences of the trend of immigration as shown in the graph above.
You will find an interactive feature below* which shows the changing rate of the foreign born population over time and anti-immigration laws throughout American history, such as the 1790 Naturalization Act; 1882 Chinese Exclusion Act; and the Immigration Act of 1924 (also known as 1924 National Origins Quota Act or Johnson-Reed Act) . Based on the interactive, explain the connection between foreign born population and anti-immigrant laws in the U.S.
How different are the countries of origin of the foreign-born population of 1900 and of today? (see below)*
What portion of US citizens do you think are welcoming to our foreign-born population?
When thinking about the current foreign-born US population, do you think push or pull factors are stronger?
It is often said that the US is a melting pot. In the comments section, predict what the US will look like in one generation and whether the most recent foreign-born population will have melted into Americans:
Use one or two emojis to characterize America’s relationship with immigrants.
Learning Extension
Check out this super-cool interactive feature from the Pew Research Center to watch immigration change the United States over time.
Action Extension
Contact the White House and let the President know your thoughts about immigration in the U.S.